
Since my very first day in the wealth management business, I was exposed to the power of a diversified portfolio that covers all the boxes in the Ibbotson periodic table. For the 1st 10 years, this could not be argued. The market went through drastic swings to the downside like the Tech bubble of 2000 or Financial Crisis of 2007. Most diversified portfolios did have favorable performance to the S&P 500, but still negative. The rule of thumb in investing did its job.
As I look back over the last decade, the results don’t seem as successful. This can be attributed to many factors, most importantly the risky investor became “not so risky” after the Great Recession of 2007. This could be interpreted that the investor was not risky at all, but the power of wealth can sometimes skew the emotions that come with investing in stocks and assessing one’s risk appetite.
I recently had the pleasure to meet with a Representative with Blackrock Funds and ETF’s. Blackrock has always been a firm that I paid great attention to. After all, they started as a risk assessment firm before they became one of the largest investment management companies in the world. I expressed my frustration with giving the suitable advice to clients and getting burned by underperformance of the portfolio to the S&P 500. Even though a majority of the assets held for the client were not in the S&P 500. A typical Growth and Income portfolio made up of 40% bonds, 60% stocks of all capitalizations and global presence, was being compared to the S&P 500 index.
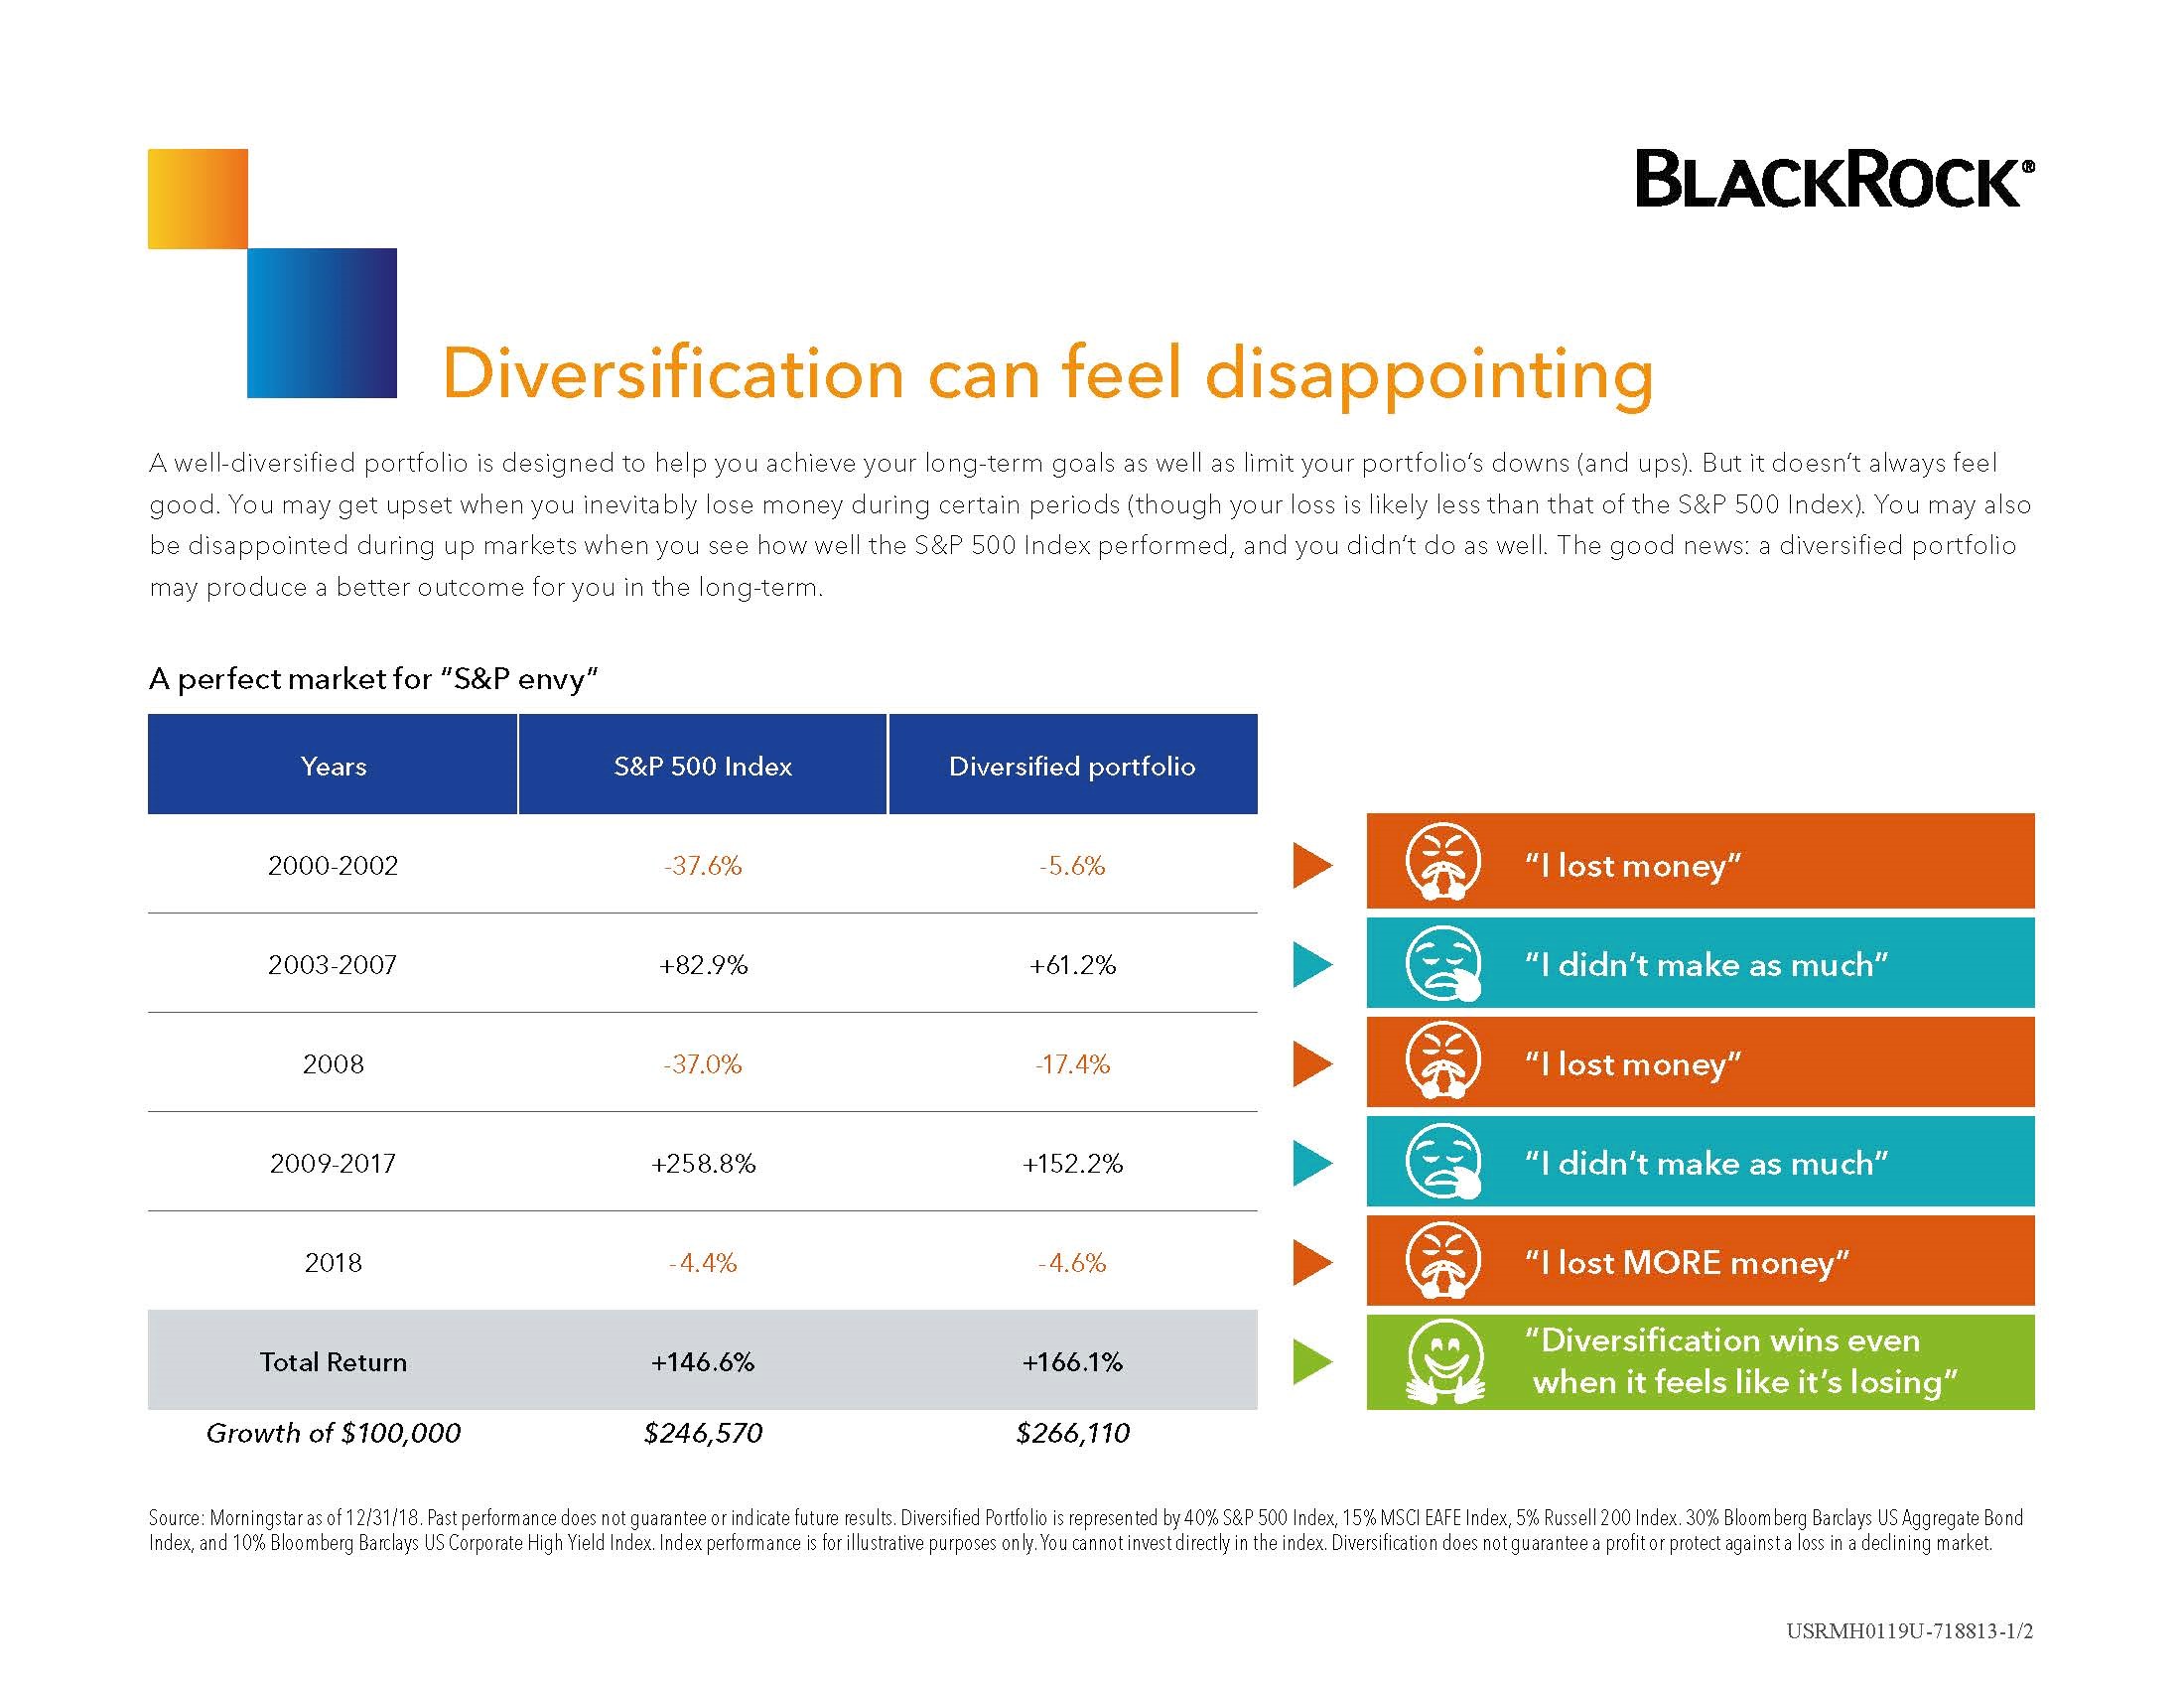
Figure 1
The representative had a great slide that was put together by Blackrock (figure 1). It is a simple chart that tracks the S&P 500 and a diversified portfolio of 60% S&P 500 / 40% U.S. Aggregate bond. This comparison is easy to see that the returns are much different in each column. This comes as no surprise, because the risk is not the same. The diversified portfolio only has 60% exposure to equity markets.
The most important visual for me was the client thoughts on the right. In the years 2000-2002, the client was not happy being down -13.3% “I LOST MONEY”. Albeit not as much as the S&P500 -37.6%. The same is true for 2008 and 2018. Conversely, when the portfolio was up in the years 2009-2017 (+152.1%), but lagged the S&P (+258.8%), the client was not happy because they didn’t make as much. This was not a drastic as 2003-2007, but still has the same characteristics. This has been my experience through my 20+ years in the industry.
We always tell our client invest for the future, with a long term time horizon. Trust your allocation and risk assessment. These thoughts ring true at the bottom of this slide “Total Return”. The growth of $100,000 from 2000-2018 is $246,570 (S&P 500) and $266,110 (diversified portfolio). Even though the diversity did not perform as well in the big up years, the client still won in the long run!!! Yes, not by a lot of actual dollars, but remember you are only taking 60% of the risk of the market.
Jason Jennings, CFP®
Managing Partner